Was out exploring north of Vegreville with Anna yesterday where a community by the name of Brush Hills used to be. I figure the settlement was abandoned between 1950-1975. Hard to know for sure because I can’t find any information about this place. Will try the Vegreville Museum to see if they can come up with anything. A nice lady from the museum directed Anna to the abandoned church we were looking for in this area. (I will be going back to take sunrise photos of the church) We found so many things to take photos of such as; abandoned cars, farmyards, machinery, and single trees. Most of these items seem to be sunrise oriented though. The best part is everything is within a 5 mile radius.
Anyway, we found this tree in a cow pasture and I decided to come here for sunset. I’m thinking the light could be better here at sunrise to illuminate the tree a little more. This shot is a 3 exposure blend.
I like how the cloud formations are mimicking the branches of the tree. I plan on coming back to this location to observe the light during sunrise as well. The Lee “Big Stopper” 10 stop ND filter I just picked up might work well here with some cloud movement.
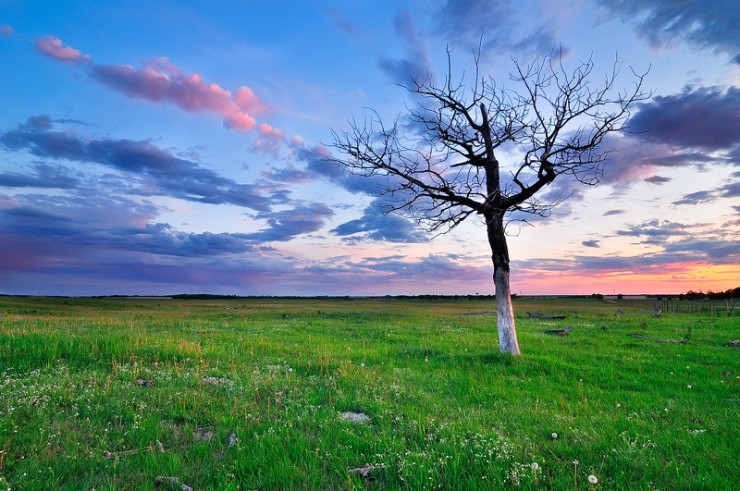
“Tree Tentacles” north of Vegreville, Alberta.
Buy this print here.
2 Comments
[…] along with my good friend Nick. I wanted to take shots of the full moon rising under the tree from this location. It’s about an hour and a half drive from Edmonton and we got to the field with the moon just […]
[…] along with my good friend Nick. I wanted to take shots of the full moon rising under the tree from this location. It’s about an hour and a half drive from Edmonton and we got to the field with the moon just […]